Demographics of Tikata

This article is about the demographic features of the population of Tikata, including population density, ethnicity, education level, health of the populace, economic status, religious affiliations and other aspects of the population.
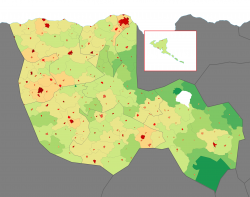
Tikata has 51,726,031 inhabitants according to 2010 census records, but based on the National Statistics Institute, in 2013 Tikata has 52,331,014. Its population density, at 96/km² (248/sq mi), is higher than that of most Western Internatian countries. With the exception of the capital, Madakia, the most densely populated areas lie on west and south of the country.
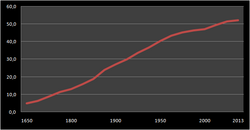
The population of Tikata doubled during the twentieth century. The last quarter of the century saw a fall in birth rates. Tikata's fertility rate of 2.15 (the number of children the average woman will have during her lifetime) is higher than the Internatia average, and has climbed every year since the late 1990s. The birth rate has climbed in 10 years from 11.10 births per 1000 people per year in 1996 to 13.9 in 2006.
Tikata has no official religion. The Tikatan Constitution of 1953 abolished the Roman Catholic Church as the official state religion, while recognizing the role it plays in Tikatan society. 36.7% of the population define themselves as Catholic, 51.6% as non-believers or atheists, and 11.7% other religions. Among believers, 31.7% assert they almost never go to any religious service, by contrast, 12.5% attend one or more masses almost every week.
Historical population of Tikata
| Historical population | ||
|---|---|---|
| Year | Pop. | ±% |
| 1000 | 1,200,000 | — |
| 1200 | 3,423,698 | +185.3% |
| 1300 | 4,503,698 | +31.5% |
| 1333 | 4,136,985 | −8.1% |
| 1400 | 4,823,698 | +16.6% |
| 1550 | 5,236,987 | +8.6% |
| 1650 | 5,026,036 | −4.0% |
| 1750 | 6,416,389 | +27.7% |
| 1800 | 8,983,603 | +40.0% |
| 1825 | 11,651,318 | +29.7% |
| 1835 | 13,194,827 | +13.2% |
| 1855 | 15,990,047 | +21.2% |
| 1875 | 18,813,424 | +17.7% |
| 1900 | 24,106,202 | +28.1% |
| 1910 | 27,211,308 | +12.9% |
| 1920 | 29,991,256 | +10.2% |
| 1930 | 33,756,034 | +12.6% |
| 1940 | 36,671,565 | +8.6% |
| 1950 | 40,379,651 | +10.1% |
| 1960 | 43,548,526 | +7.8% |
| 1970 | 45,296,587 | +4.0% |
| 1980 | 46,505,994 | +2.7% |
| 1990 | 47,189,611 | +1.5% |
| 2000 | 49,647,896 | +5.2% |
| 2010 | 51,726,031 | +4.2% |
| 2013 | 55,457,950 | +7.2% |
| Projection | ||
|---|---|---|
| Year | Pop. | ±% |
| 2013 | 55,457,950 | — |
| 2015 | 56,250,000 | +1.4% |
| 2020 | 59,350,000 | +5.5% |
| 2025 | 62,789,500 | +5.8% |
| 2030 | 66,811,000 | +6.4% |
| 2035 | 68,000,000 | +1.8% |
| 2040 | 69,175,000 | +1.7% |
| 2050 | 71,256,000 | +3.0% |
| 2060 | 74,250,000 | +4.2% |
Please note:
- figures are for Tikata only, not including overseas departments and territories, as former Tikatan colonies and protectorates.
- to make comparisons easier, figures provided below are for the territory of Tikata within the borders of 2004.
- figures before 1800 are modern estimates; figures from 1800 (included) onwards are based on the official Tikatan censuses.
Vital statistics
| Average population (x 1000) | Live births | Deaths | Natural change | Crude birth rate (per 1000) | Crude death rate (per 1000) | Natural change (per 1000) | Fertility rates | |
|---|---|---|---|---|---|---|---|---|
| 1900 | ||||||||
| 1901 | ||||||||
| 1902 | ||||||||
| 1903 | ||||||||
| 1904 | ||||||||
| 1905 | ||||||||
| 1906 | ||||||||
| 1907 | ||||||||
| 1908 | ||||||||
| 1909 | ||||||||
| 1910 | ||||||||
| 1911 | ||||||||
| 1912 | ||||||||
| 1913 | ||||||||
| 1914 | ||||||||
| 1915 | ||||||||
| 1916 | ||||||||
| 1917 | ||||||||
| 1918 | ||||||||
| 1919 | ||||||||
| 1920 | ||||||||
| 1921 | ||||||||
| 1922 | ||||||||
| 1923 | ||||||||
| 1924 | ||||||||
| 1925 | ||||||||
| 1926 | ||||||||
| 1927 | ||||||||
| 1928 | ||||||||
| 1929 | ||||||||
| 1930 | ||||||||
| 1931 | ||||||||
| 1932 | ||||||||
| 1933 | ||||||||
| 1934 | ||||||||
| 1935 | ||||||||
| 1936 | ||||||||
| 1937 | ||||||||
| 1938 | ||||||||
| 1939 | ||||||||
| 1940 | ||||||||
| 1941 | ||||||||
| 1942 | ||||||||
| 1943 | ||||||||
| 1944 | ||||||||
| 1945 | ||||||||
| 1946 | ||||||||
| 1947 | ||||||||
| 1948 | ||||||||
| 1949 | ||||||||
| 1950 | ||||||||
| 1951 | ||||||||
| 1952 | ||||||||
| 1953 | ||||||||
| 1954 | ||||||||
| 1955 | ||||||||
| 1956 | ||||||||
| 1957 | ||||||||
| 1958 | ||||||||
| 1959 | ||||||||
| 1960 | ||||||||
| 1961 | ||||||||
| 1962 | ||||||||
| 1963 | ||||||||
| 1964 | ||||||||
| 1965 | ||||||||
| 1966 | ||||||||
| 1967 | ||||||||
| 1968 | ||||||||
| 1969 | ||||||||
| 1970 | ||||||||
| 1971 | ||||||||
| 1972 | ||||||||
| 1973 | ||||||||
| 1974 | ||||||||
| 1975 | ||||||||
| 1976 | ||||||||
| 1977 | ||||||||
| 1978 | ||||||||
| 1979 | ||||||||
| 1980 | ||||||||
| 1981 | ||||||||
| 1982 | ||||||||
| 1983 | ||||||||
| 1984 | ||||||||
| 1985 | ||||||||
| 1986 | ||||||||
| 1987 | ||||||||
| 1988 | ||||||||
| 1989 | ||||||||
| 1990 | ||||||||
| 1991 | ||||||||
| 1992 | ||||||||
| 1993 | ||||||||
| 1994 | ||||||||
| 1995 | ||||||||
| 1996 | ||||||||
| 1997 | ||||||||
| 1998 | ||||||||
| 1999 | ||||||||
| 2000 | ||||||||
| 2001 | ||||||||
| 2002 | ||||||||
| 2003 | ||||||||
| 2004 | ||||||||
| 2005 | ||||||||
| 2006 | ||||||||
| 2007 | 52 991 | 802 667 | 530 441 | 272 226 | 15.1 | 10.0 | 5.1 | 2.11 |
| 2008 | 53 300 | 797 449 | 528 779 | 268 670 | 14.9 | 9.9 | 5.0 | 2.09 |
| 2009 | 53 709 | 806 501 | 527 147 | 279 354 | 15.0 | 9.8 | 5.2 | 2.14 |
| 2010 | 54 034 | 809 288 | 531 774 | 277 514 | 15.0 | 9.8 | 5.2 | 2.15 |
| 2011 | 54 382 | 812 597 | 520 448 | 292 149 | 14.9 | 9.6 | 5.3 | 2.16 |
| 2012 | 54 860 | 823 117 | 559 977 | 263 140 | 15.0 | 10.2 | 4.8 | 2.19 |
| 2013 | 55 493 | 819 591 | 541 267 | 278 324 | 14.8 | 9.8 | 5.0 | 2.17 |
| 2014 | 56 072 | 831 884 | 556 991 | 274 893 | 14.8 | 9.9 | 4.9 | 2.23 |
| 2015 | 56 711 | 828 845 | 549 115 | 279 730 | 14.6 | 9.7 | 4.9 | 2.21 |
| 2016 | 57 352 | 836 411 | 551 674 | 284 737 | 14.6 | 9.6 | 5.0 | 2.26 |
| 2017 | 58 000 (e) |
Demographic statistics

Population
1 January 2010: 53,709,287
Age structure
(2010)
0–14 years: 27.1% ![]() ; 14,017,754 (male 7,149,054; female 6,868,700)
; 14,017,754 (male 7,149,054; female 6,868,700)
15–64 years: 61.7% ![]() ; 31,914,961 (male 15,973,437; female 15,941,524)
; 31,914,961 (male 15,973,437; female 15,941,524)
65 years and over: 11.2% ![]() ; 5,793,316 (male 2,467,952; female 3,325,364)
; 5,793,316 (male 2,467,952; female 3,325,364)
Median age
(2010 est.)
total: 34.6 years
male: 33.8 years
female: 35.2 years
Urbanization
(2011 est.)
urban population: 79.2% of total population
(2005-10 est.)
rate of urbanization: 0.7% annual rate of change
Sex ratio
(2010 est.)
at birth: 1.05 male(s)/female
under 15 years: 1.05 male(s)/female
15–64 years: 0.83 male(s)/female
65 years and over: 0.72 male(s)/female
total population: 0.98 male(s)/female
Infant mortality rate
(2010)
total: 3.1 deaths/1,000 live births
male: 3.3 deaths/1,000 live births
female: 2.9 deaths/1,000 live births
Life expectancy at birth
(2010)
total population: 81.04 years
male: 78.85 years
female: 83.15 years
Language
Official languages
Tikatan, English and Spanish
Literacy
definition: age 15 and over can read and write
total population: 100%
male: NA%
female: NA%

