Olomi
| Olomi | |
|---|---|
Coat of arms
| |
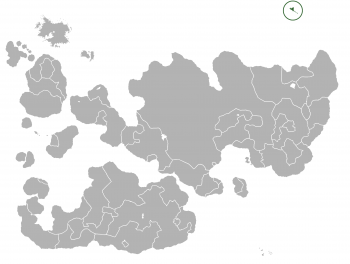
 Location of Olomi in Internatia. | |
| Capital and largest city | Nalundre |
| Official languages | Olomese Tikatan |
| Demonym | Olomese |
| Sovereign state | |
| Government | Parliamentary constitutional monarchy |
• Monarch | Michael II |
| Odo Martens | |
| Leo Brannesen | |
| Legislature | Svunfd |
| Formation | |
• Unified with Tikata | c. 1165 |
• Statehood | 1 January 1971 |
• Gained home rule | 1 March 2014 |
| Area | |
• Total | 2,922 km2 (1,128 sq mi) |
• Water (%) | 0.5 |
| Population | |
• November 2014 estimate | 179,027 |
• 2013 census | 177,896 |
• Density | 60.88/km2 (157.7/sq mi) |
| HDI (2008) | 0.950 very high |
| Currency | Ryta (TRY) |
| Time zone | FIT (UTC+3:00) |
| Drives on the | right |
| Calling code | +72 |
| Internet TLD | .om |
Olomi is an archipelago and autonomous country within the Federal Kingdom of Tikata, situated on Aeturnum Ocean. The total area is approximately 2.922 km2 (1,128 sq mi) with a 2013 population of almost 178,000 people.
Olomi have been a self-governing country within the Tikatan Realm since 2014. Over the years, the Olomese have taken control of most domestic matters. Areas that remain the responsibility of Tikata include military defence, police, justice, currency and foreign affairs. Olomese also have representatives in the Internatia Council as members of the Tikatan delegation.
Administrative divisions
Olomi, with a total area of 2.922 square kilometres (1.128 sq mi), is divided into nine counties. The countiesare further subdivided into 61 municipalities. The counties were created on 1 September 2014 to replace the 3 former regions.
| County | Capital | Population | Area | Density |
|---|---|---|---|---|
| Bay | Qinto | 38,511 | 474 km2 | 81.25 |
| Capilla | Ginerna | 9,023 | 72 km2 | 125.32 |
| Kribe | Kribedsa | 20,914 | 665 km2 | 31.45 |
| Nambere | Nalundre | 74,267 | 191 km2 | 388.83 |
| San Angelo | Lipcona | 4,985 | 92 km2 | 54.18 |
| Snake Island | Kayete | 3,671 | 89 km2 | 41.25 |
| Solian | Berus | 7,142 | 528 km2 | 13.53 |
| Sumeto | New Tramandi | 11,257 | 328 km2 | 34.32 |
| Upper | Colmea | 8,126 | 483 km2 | 16.82 |
Demographics
| Rank | County | Pop. | |||||||
|---|---|---|---|---|---|---|---|---|---|
 Nalundre  Qinto |
1 | Nalundre | Nambere | 71,256 |  Kribedsa  New Tramandi | ||||
| 2 | Qinto | Bay | 33,509 | ||||||
| 3 | Kribedsa | Kribe | 12,093 | ||||||
| 4 | New Tramandi | Sumeto | 7,757 | ||||||
| 5 | Vibera | Kribe | 6,311 | ||||||
| 6 | Ginerna | Capilla | 5,648 | ||||||
| 7 | Colmea | Upper | 4,891 | ||||||
| 8 | Berus | Solian | 3,219 | ||||||
| 9 | Queen City | Bay | 3,017 | ||||||
| 10 | Lipcona | San Angelo | 2,628 | ||||||
| Historical population | ||
|---|---|---|
| Year | Pop. | ±% |
| 1800 | 98,447 | — |
| 1825 | 121,268 | +23.2% |
| 1835 | 139,447 | +15.0% |
| 1855 | 152,147 | +9.1% |
| 1875 | 167,211 | +9.9% |
| 1900 | 164,251 | −1.8% |
| 1910 | 171,269 | +4.3% |
| 1920 | 179,145 | +4.6% |
| 1930 | 182,038 | +1.6% |
| 1940 | 183,911 | +1.0% |
| 1950 | 183,206 | −0.4% |
| 1960 | 181,264 | −1.1% |
| 1970 | 172,516 | −4.8% |
| 1980 | 163,257 | −5.4% |
| 1990 | 157,236 | −3.7% |
| 2000 | 165,236 | +5.1% |
| 2010 | 170,396 | +3.1% |
| 2013 | 177,896 | +4.4% |
| 2014(est.) | 179,027 | +0.6% |


